All amounts are in
“We delivered another strong start to the year across a number of fronts, following a record performance in 2023. Costs were in line with guidance for the quarter and production exceeded guidance led by record production from La
First Quarter 2024 Operational and Financial Highlights
- Produced 135,700 ounces of gold, exceeding quarterly guidance and representing a 6% increase from the first quarter of 2023. This was driven by another strong performance from the
Mulatos District , including record quarterly production from LaYaqui Grande - Sold 132,849 ounces of gold at an average realized price of
$2,069 per ounce, generating record quarterly revenue of$277.6 million , a 10% increase from the first quarter of 2023 - Total cash costs1 were
$910 per ounce, all-in sustaining costs ("AISC"1) were$1,265 per ounce, and cost of sales were$1,307 per ounce. As previously guided, costs were above full year guidance in the first quarter, with AISC also impacted by an increase in share-based compensation reflecting the Company's higher share price in the quarter. Costs are expected to decrease through the remainder of the year to be consistent with full year guidance - Strong ongoing free cash flow1 generation of
$24.4 million , while funding the Phase 3+ Expansion at Island Gold, and net of$45.3 million of cash tax payments inMexico - Cash flow from operating activities of
$108.9 million (including$134.9 million , or$0.34 per share before changes in working capital1) - Realized adjusted net earnings1 for the first quarter of
$51.2 million , or$0.13 per share1. Adjusted net earnings includes adjustments for net unrealized foreign exchange losses recorded within deferred taxes and foreign exchange of$4.5 million , and other adjustments, net of taxes totaling$4.6 million . - Reported net earnings were
$42.1 million , or$0.11 per share - Cash and cash equivalents increased 7% from the end of 2023 to
$240.2 million , with no debt and$16.3 million in equity securities - Paid dividends of
$9.8 million , or$0.025 per share for the quarter - Reported year-end 2023 Mineral Reserves of 10.7 million ounces of gold, a 2% increase from 2022, with grades also increasing 1%. This marked the fifth consecutive year Mineral Reserves have grown for a combined increase of 10% with grades also increasing 9% over that time frame. Additionally, Measured and Indicated Mineral Resources increased 12% to 4.4 million ounces, with grades increasing 9%, and Inferred Mineral Resources increased 3% to 7.3 million ounces, at 1% higher grades
- Announced a definitive agreement to acquire Argonaut Gold Inc. ("Argonaut") and its Magino mine, located adjacent to the Company's Island Gold mine in
Ontario, Canada . The integration of the two operations is expected to create one of the largest and lowest cost gold mines inCanada and unlock significant value with pre-tax synergies expected to total$515 million 2 through the use of shared infrastructure - On
April 4, 2024 , announced the closing of the previously announced non-brokered private placement for common shares of Argonaut, representing approximately 13.8% of Argonaut's outstanding common shares for CAD$50 million - Completed the acquisition of Orford Mining Corporation ("Orford") on
April 3, 2024 , through which the Company consolidated its existing ownership of Orford shares and added the highly prospectiveQiqavik Gold Project , located inQuebec, Canada
(1) Refer to the “Non-GAAP Measures and Additional GAAP Measures” disclosure at the end of this press release and associated MD&A for a description and calculation of these measures.
(2) Synergies are pre-tax and undiscounted. On a discounted basis, this represents an after-tax net present value of
Highlight Summary
| Three Months Ended | ||||
| 2024 | 2023 | |||
| Financial Results (in millions) | ||||
| Operating revenues | ||||
| Cost of sales (1) | ||||
| Earnings from operations | ||||
| Earnings before income taxes | ||||
| Net earnings | ||||
| Adjusted net earnings (2) | ||||
| Earnings before interest, taxes, depreciation and amortization (2) | ||||
| Cash provided by operations before working capital and taxes paid (2) | ||||
| Cash provided by operating activities | ||||
| Capital expenditures (sustaining) (2) | ||||
| Capital expenditures (growth) (2) | ||||
| Capital expenditures (capitalized exploration) | ||||
| Free cash flow (2) | ||||
| Operating Results | ||||
| Gold production (ounces) | 135,700 | 128,400 | ||
| Gold sales (ounces) | 132,849 | 132,668 | ||
| Per Ounce Data | ||||
| Average realized gold price | ||||
| Average spot gold price (London PM Fix) | ||||
| Cost of sales per ounce of gold sold (includes amortization) (1) | ||||
| Total cash costs per ounce of gold sold (2) | ||||
| All-in sustaining costs per ounce of gold sold (2) | ||||
| Share Data | ||||
| Earnings per share, basic and diluted | ||||
| Adjusted earnings per share, basic (2) | ||||
| Weighted average common shares outstanding (basic) (000’s) | 396,817 | 393,960 | ||
| Financial Position (in millions) | ||||
| Cash and cash equivalents | ||||
(1) Cost of sales includes mining and processing costs, royalties, and amortization expense.
(2) Refer to the “Non-GAAP Measures and Additional GAAP Measures” disclosure at the end of this press release and associated MD&A for a description and calculation of these measures.
| Three Months Ended | ||||
| 2024 | 2023 | |||
| Gold production (ounces) | ||||
| 40,100 | 45,000 | |||
| Island Gold | 33,400 | 32,900 | ||
| 62,200 | 50,500 | |||
| Gold sales (ounces) | ||||
| 39,810 | 45,676 | |||
| Island Gold | 34,130 | 33,727 | ||
| 58,909 | 53,265 | |||
| Cost of sales (in millions) (1) | ||||
| Island Gold | ||||
| Cost of sales per ounce of gold sold (includes amortization) (1) | ||||
| Island Gold | ||||
| Total cash costs per ounce of gold sold (2) | ||||
| Island Gold | ||||
| Mine-site all-in sustaining costs per ounce of gold sold (2),(3) | ||||
| Island Gold | ||||
| Capital expenditures (sustaining, growth, and capitalized exploration) (in millions) (2) | ||||
| Island Gold (5) | ||||
| Other | ||||
(1) Cost of sales includes mining and processing costs, royalties, and amortization expense.
(2) Refer to the “Non-GAAP Measures and Additional GAAP Measures” disclosure at the end of this press release and associated MD&A for a description and calculation of these measures.
(3) For the purposes of calculating mine-site all-in sustaining costs, the Company does not include an allocation of corporate and administrative and share based compensation expenses.
(4) Includes capitalized exploration at
(5) Includes capitalized exploration at Island Gold of
(6) Includes capitalized exploration at
(7)
Environment, Social and Governance Summary Performance
Health and Safety
- Total recordable injury frequency rate1 ("TRIFR") of 1.79 in the first quarter of 2024, an increase from 1.45 in the fourth quarter of 2023
- Lost time injury frequency rate1 ("LTIFR") of nil, a decrease from 0.10 in the fourth quarter of 2023
La Yaqui Grande Mine celebrated four million hours without a lost time injury- Alamos’ Home Safe Every Day safety leadership training was implemented at the
Island Gold Mine , where it will be delivered to all employees as part of the site’s safety training. This program is now available at all Alamos operations - During the first quarter of 2024, Alamos had 18 recordable injuries across its sites and zero lost time injuries
Alamos strives to maintain a safe, healthy working environment for all, with a strong safety culture where everyone is continually reminded of the importance of keeping themselves and their colleagues healthy and injury-free. The Company’s overarching commitment is to have all employees and contractors return Home Safe Every Day.
Environment
- Zero significant environmental incidents and zero reportable spills in the first quarter of 2024
- One externally reportable non-compliance in the first quarter that resulted in a fine. At
Young -Davidson , environmental testing of treated mine water determined a toxicity failure for Daphnia magna (water fleas), resulting in an environmental penalty of$14,000 . The investigation determined the cause of the failure to be algae build-up in the mine water discharge pond and remediation measures were taken. Water treatment and discharge were not impacted and the mine has been in full compliance subsequent to the event - Finalized a fish habitat compensation project for
Davidson Creek atYoung -Davidson - Reclamation work underway at Mulatos focused on the closed
Cerro Pelon ,El Victor andSan Carlos pits
The Company is committed to preserving the long-term health and viability of the natural environment that surrounds its operations and projects. This includes investing in new initiatives to reduce our environmental footprint with the goal of minimizing the environmental impacts of our activities and offsetting any impacts that cannot be fully mitigated or rehabilitated.
Community
Ongoing donations, medical support and infrastructure investments were provided to local communities, including:
- Various sponsorships to support local youth sports teams and community events, and donations to local charities and organizations around the Company's mines
- Partnered with a local foundation (Fundación Vamos Juntos a Ganar) to organize an entrepreneurship workshop for residents of Matarachi to increase their capacity for opening or improving local businesses
- Provided ongoing health services to local community members around the
Mulatos Mine . During the quarter, free dental services, vaccinations, and Pap tests were provided to residents - Upgraded public lighting in Matarachi with the installation of 96 solar street lights throughout the town
- Completed the annual Mi Matarachi evaluation and planning meeting with residents of Matarachi, working together to develop actions that promote education, health and infrastructure that improve the quality of life for residents
The Company believes that excellence in sustainability provides a net benefit to all stakeholders. The Company continues to engage with local communities to understand local challenges and priorities. Ongoing investments in local infrastructure, health care, education, cultural and community programs remain a focus of the Company.
Governance and Disclosure
- Completed annual fieldwork and assurance of Alamos’ compliance with the World Gold Council’s Responsible Gold Mining Principles (RGMPs). Alamos will publish its 2023 RGMP Report in the second quarter of 2024
- Prepared Alamos’ inaugural Modern Slavery Report in accordance with Canada’s Fighting Against Forced Labour and Child Labour in Supply Chains Act. Alamos will publish its 2023 Modern Slavery Report in
May 2024
The Company maintains the highest standards of corporate governance to ensure that corporate decision-making reflects its values, including the Company’s commitment to sustainable development.
(1) Frequency rate is calculated as incidents per 200,000 hours worked.
Outlook and Strategy
| 2024 Guidance (4) | |||||||||
| Island Gold | Mulatos | Total | |||||||
| Gold production (000's ounces) | 180 - 195 | 145 - 160 | 160 - 170 | 485 - 525 | |||||
| Cost of sales, including amortization (in millions)(3) | $620 | ||||||||
| Cost of sales, including amortization ($ per ounce)(3) | $1,225 | ||||||||
| Total cash costs ($ per ounce)(1) | — | ||||||||
| All-in sustaining costs ($ per ounce)(1) | |||||||||
| Mine-site all-in sustaining costs ($ per ounce)(1)(2) | — | ||||||||
| Capital expenditures (in millions) | |||||||||
| Sustaining capital(1) | — | ||||||||
| Growth capital(1) | — | ||||||||
| — | |||||||||
| Growth capital - development projects | $25 | ||||||||
| Capitalized exploration(1) | $41 | ||||||||
| Total capital expenditures and capitalized exploration(1) | $34 | ||||||||
(1) Refer to the "Non-GAAP Measures and Additional GAAP" disclosure at the end of this press release and associated MD&A for a description of these measures.
(2) For the purposes of calculating mine-site all-in sustaining costs at individual mine sites, the Company does not include an allocation of corporate and administrative and share based compensation expenses to the mine sites.
(3) Cost of sales includes mining and processing costs, royalties, and amortization expense, and is calculated based on the mid-point of total cash cost guidance.
(4) 2024 Guidance does not reflect the proposed acquisition of the
The Company’s objective is to operate a sustainable business model that supports growing returns to all stakeholders over the long-term, through growing production, expanding margins, and increasing profitability. This includes a balanced approach to capital allocation focused on generating strong ongoing free cash flow while re-investing in high-return internal growth opportunities, and supporting higher returns to shareholders.
Following a record operational and financial performance in 2023, the Company continued to deliver across multiple fronts in the first quarter of 2024. Production of 135,700 ounces exceeded quarterly guidance, reflecting another strong performance from Mulatos driven by record quarterly production from La
The Phase 3+ Expansion remains on track for completion during the first half of 2026 and will be a key driver of the Company's growing production base and declining cost profile over the next several years. Work on the expansion continues to advance with shaft sinking well underway and reaching a depth of 185 metres by the end of March.
Additionally, the Company continued to demonstrate its long-term track record of value creation through exploration and M&A during the quarter. Global Mineral Reserves increased to 10.7 million ounces of gold (
The acquisition of Argonaut's Magino mine is expected to unlock significant value given its proximity to Island Gold. The integration of the two operations is expected to create one of the largest and lowest cost gold mines in
Additionally, the Company continues to invest in its longer-term portfolio of growth projects with the acquisition of Orford, adding the highly prospective
The Company provided three-year production and operating guidance in
Production is expected to be slightly higher during the first half of 2024, reflecting higher grades at La
Production is expected to increase 7% by 2026 to between 520,000 and 560,000 ounces, with AISC decreasing 11% to between
The majority of capital spending in 2024 remains focused on advancing the Phase 3+ Expansion at Island Gold. Following the closing of the acquisition of Argonaut in July, the Company will revise its 2024 capital guidance to reflect the addition of Magino and lower planned capital spending on the mill and tailings expansions at Island Gold.
Other areas of focus in 2024 include a larger capital budget for
Given the strong profitability of the Mulatos operation in 2023, the Company expects to pay significantly higher cash tax payments in
The global exploration budget for 2024 is
The Company's liquidity position remains strong, ending the quarter with
First Quarter 2024 Results
Young-Davidson Financial and Operational Review
| Three Months Ended | ||||||
| 2024 | 2023 | |||||
| Gold production (ounces) | 40,100 | 45,000 | ||||
| Gold sales (ounces) | 39,810 | 45,676 | ||||
| Financial Review (in millions) | ||||||
| Operating Revenues | ||||||
| Cost of sales (1) | ||||||
| Earnings from operations | ||||||
| Cash provided by operating activities | ||||||
| Capital expenditures (sustaining) (2) | ||||||
| Capital expenditures (growth) (2) | ||||||
| Capital expenditures (capitalized exploration) (2) | ||||||
| Mine-site free cash flow (2) | ||||||
| Cost of sales, including amortization per ounce of gold sold (1) | ||||||
| Total cash costs per ounce of gold sold (2) | ||||||
| Mine-site all-in sustaining costs per ounce of gold sold (2),(3) | ||||||
| Underground Operations | ||||||
| Tonnes of ore mined | 667,062 | 720,927 | ||||
| Tonnes of ore mined per day | 7,330 | 8,010 | ||||
| Average grade of gold (4) | 1.94 | 2.22 | ||||
| Metres developed | 1,914 | 2,695 | ||||
| Mill Operations | ||||||
| Tonnes of ore processed | 665,778 | 701,954 | ||||
| Tonnes of ore processed per day | 7,316 | 7,799 | ||||
| Average grade of gold (4) | 1.94 | 2.22 | ||||
| Contained ounces milled | 41,609 | 50,212 | ||||
| Average recovery rate | 89.4 | % | 90.0 | % | ||
(1) Cost of sales includes mining and processing costs, royalties and amortization.
(2) Refer to the “Non-GAAP Measures and Additional GAAP Measures” disclosure at the end of this press release and associated MD&A for a description and calculation of these measures.
(3) For the purposes of calculating mine-site all-in sustaining costs, the Company does not include an allocation of corporate and administrative and share based compensation expenses.
(4) Grams per tonne of gold ("g/t Au").
Operational review
Grades mined averaged 1.94 g/t Au in the quarter, a 13% decrease from the prior year period, and below the range of full year guidance, due to mine sequencing. Given the lower mining rates, higher grade stopes that had been planned for March were deferred into April. Grades mined are expected to increase to within the range of annual guidance in the second quarter and through the remainder of the year. Mill recoveries averaged 89% in the quarter, at the low end of the range of annual guidance.
Financial Review
First quarter revenues of
Cost of sales of
Total cash costs and mine-site AISC were
Capital expenditures in the first quarter included
Island Gold Financial and Operational Review
| Three Months Ended | ||||||
| 2024 | 2023 | |||||
| Gold production (ounces) | 33,400 | 32,900 | ||||
| Gold sales (ounces) | 34,130 | 33,727 | ||||
| Financial Review (in millions) | ||||||
| Operating Revenues | ||||||
| Cost of sales (1) | ||||||
| Earnings from operations | ||||||
| Cash provided by operating activities | ||||||
| Capital expenditures (sustaining) (2) | ||||||
| Capital expenditures (growth) (2) | ||||||
| Capital expenditures (capitalized exploration) (2) | ||||||
| Mine-site free cash flow (2) | ( | ) | ( | ) | ||
| Cost of sales, including amortization per ounce of gold sold (1) | ||||||
| Total cash costs per ounce of gold sold (2) | ||||||
| Mine-site all-in sustaining costs per ounce of gold sold (2),(3) | ||||||
| Underground Operations | ||||||
| Tonnes of ore mined | 106,737 | 108,396 | ||||
| Tonnes of ore mined per day ("tpd") | 1,173 | 1,204 | ||||
| Average grade of gold (4) | 10.53 | 9.56 | ||||
| Metres developed | 1,787 | 2,103 | ||||
| Mill Operations | ||||||
| Tonnes of ore processed | 107,215 | 107,507 | ||||
| Tonnes of ore processed per day | 1,178 | 1,195 | ||||
| Average grade of gold (4) | 10.63 | 9.57 | ||||
| Contained ounces milled | 36,651 | 33,082 | ||||
| Average recovery rate | 97.3 | % | 97.0 | % | ||
(1) Cost of sales includes mining and processing costs, royalties, and amortization.
(2) Refer to the “Non-GAAP Measures and Additional GAAP Measures” disclosure at the end of this press release and associated MD&A for a description and calculation of these measures.
(3) For the purposes of calculating mine-site all-in sustaining costs, the Company does not include an allocation of corporate and administrative and share based compensation expenses.
(4) Grams per tonne of gold ("g/t Au").
Operational review
Island Gold produced 33,400 ounces in the first quarter of 2024, consistent with the prior year period. Underground mining rates averaged 1,173 tpd in the first quarter, a 3% decrease from the prior year period and slightly below annual guidance of 1,200 tpd. Grades mined averaged 10.53 g/t Au in the quarter, consistent with annual guidance and 10% higher than in the prior year period.
Mill throughput averaged 1,178 tpd for the quarter, slightly lower than the prior year period reflecting mining rates in the quarter. Mill recoveries averaged 97% in the first quarter, consistent with guidance.
Financial Review
Revenues of
Cost of sales of
Total cash costs of
Total capital expenditures were
Mine-site free cash flow was negative
Mulatos District Financial and Operational Review
| Three Months Ended | ||||||
| 2024 | 2023 | |||||
| Gold production (ounces) | 62,200 | 50,500 | ||||
| Gold sales (ounces) | 58,909 | 53,265 | ||||
| Financial Review (in millions) | ||||||
| Operating Revenues | ||||||
| Cost of sales (1) | ||||||
| Earnings from operations | ||||||
| Cash provided by operating activities | ||||||
| Capital expenditures (sustaining) (2) | ||||||
| Capital expenditures (growth) (2) | ||||||
| Capital expenditures (capitalized exploration) (2) | ||||||
| Mine-site free cash flow (2) | ||||||
| Cost of sales, including amortization per ounce of gold sold (1) | ||||||
| Total cash costs per ounce of gold sold (2) | ||||||
| Mine site all-in sustaining costs per ounce of gold sold (2),(3) | ||||||
| Open Pit Operations | ||||||
| Tonnes of ore mined - open pit (4) | 986,214 | 1,032,944 | ||||
| Total waste mined - open pit (6) | 4,076,910 | 5,830,815 | ||||
| Total tonnes mined - open pit | 5,063,125 | 6,863,759 | ||||
| Waste-to-ore ratio (operating) | 4.13 | 5.64 | ||||
| Crushing and Heap Leach Operations | ||||||
| Tonnes of ore stacked | 981,740 | 1,019,634 | ||||
| Average grade of gold processed (5) | 1.31 | 1.55 | ||||
| Contained ounces stacked | 41,398 | 50,922 | ||||
| Average recovery rate | 120.8 | % | 75.0 | % | ||
| Ore crushed per day (tonnes) | 10,800 | 11,329 | ||||
| Open Pit Operations | ||||||
| Tonnes of ore mined - open pit (4) | — | 1,001,785 | ||||
| Total waste mined - open pit (6) | — | 611,755 | ||||
| Total tonnes mined - open pit | — | 1,613,539 | ||||
| Waste-to-ore ratio (operating) | — | 0.61 | ||||
| Crushing and Heap Leach Operations | ||||||
| Tonnes of ore stacked | — | 1,229,076 | ||||
| Average grade of gold processed (5) | — | 0.92 | ||||
| Contained ounces stacked | — | 36,541 | ||||
| Average recovery rate | — | 33 | % | |||
| Ore crushed per day (tonnes) | — | 13,700 | ||||
(1) Cost of sales includes mining and processing costs, royalties, and amortization expense.
(2) Refer to the “Non-GAAP Measures and Additional GAAP Measures” disclosure at the end of this press release and associated MD&A for a description and calculation of these measures.
(3) For the purposes of calculating mine-site all-in sustaining costs, the Company does not include an allocation of corporate and administrative and share based compensation expenses.
(4) Includes ore stockpiled during the quarter.
(5) Grams per tonne of gold ("g/t Au").
(6) Total waste mined includes operating waste and capitalized stripping.
Mulatos District Operational Review
La
Mulatos produced 12,200 ounces in the first quarter following commencement of residual leaching in
Financial Review (
Revenues of
Cost of sales of
Total cash costs of
Capital expenditures totaled
First Quarter 2024 Development Activities
Island Gold (
Phase 3+ Expansion
On
The Phase 3+ Expansion to 2,400 tpd from the current rate of 1,200 tpd will involve various infrastructure investments. These include the installation of a shaft, paste plant, expansion of the mill as well as accelerated development to support the higher mining rates. Following the completion of the expansion in 2026, the operation will transition from trucking ore and waste up the ramp to skipping ore and waste to surface through the new shaft infrastructure, driving production higher and costs significantly lower.
With the acquisition of Argonaut's Magino mine expected to close in July, the expansion of the Island Gold mill and tailings facility will no longer be required providing immediate capital savings. Starting in 2025, ore from Island Gold is expected to be processed through the larger and more cost effective Magino mill, providing significant ongoing operating synergies.
Construction of the Phase 3+ Expansion continued through the first quarter of 2024 with progress summarized below:
- Completed the mechanical and electrical outfitting for hoist house and headframe
- Shaft sinking advanced to a depth of 185 metres (“m”) by the end of the first quarter with sinking rates increasing to 2.5 m per day in March
Paste plant detailed engineering 85% complete; issuance of long lead time equipment procurement packages is ongoing with construction activities expected to begin in the second half of 2024- Advanced lateral development to support higher mining rates with the Phase 3+ Expansion
The Phase 3+ Expansion remains on schedule to be completed during the first half of 2026. During the first quarter of 2024, the Company spent
| (in US$M) Growth capital (including indirects and contingency) | P3+ 2400 Study1 | Spent to date2 | Committed to date | % of Spent & Committed | |||
| 229 | 156 | 52 | 91% | ||||
| Mill Expansion4 | 76 | 11 | 7 | 24% | |||
| Paste Plant | 52 | 4 | 24 | 54% | |||
| Power Upgrade | 24 | 11 | 4 | 63% | |||
| 16 | — | — | — | ||||
| General Indirect Costs | 64 | 38 | 6 | 69% | |||
| Contingency3 | 55 | — | — | ||||
| 61% | |||||||
| Underground Equipment & Infrastructure | 79 | 34 | — | 43% | |||
| 162 | 82 | — | 51% | ||||
| 57% | |||||||
(1) Phase 3+ 2400 Study is as of
(2) Amount spent to date accounted for on an accrual basis, including working capital movements.
(3) Contingency has been allocated to the various areas.
(4) No further capital is expected to be incurred on the Island Gold mill expansion with the acquisition of Argonaut, expected to close in
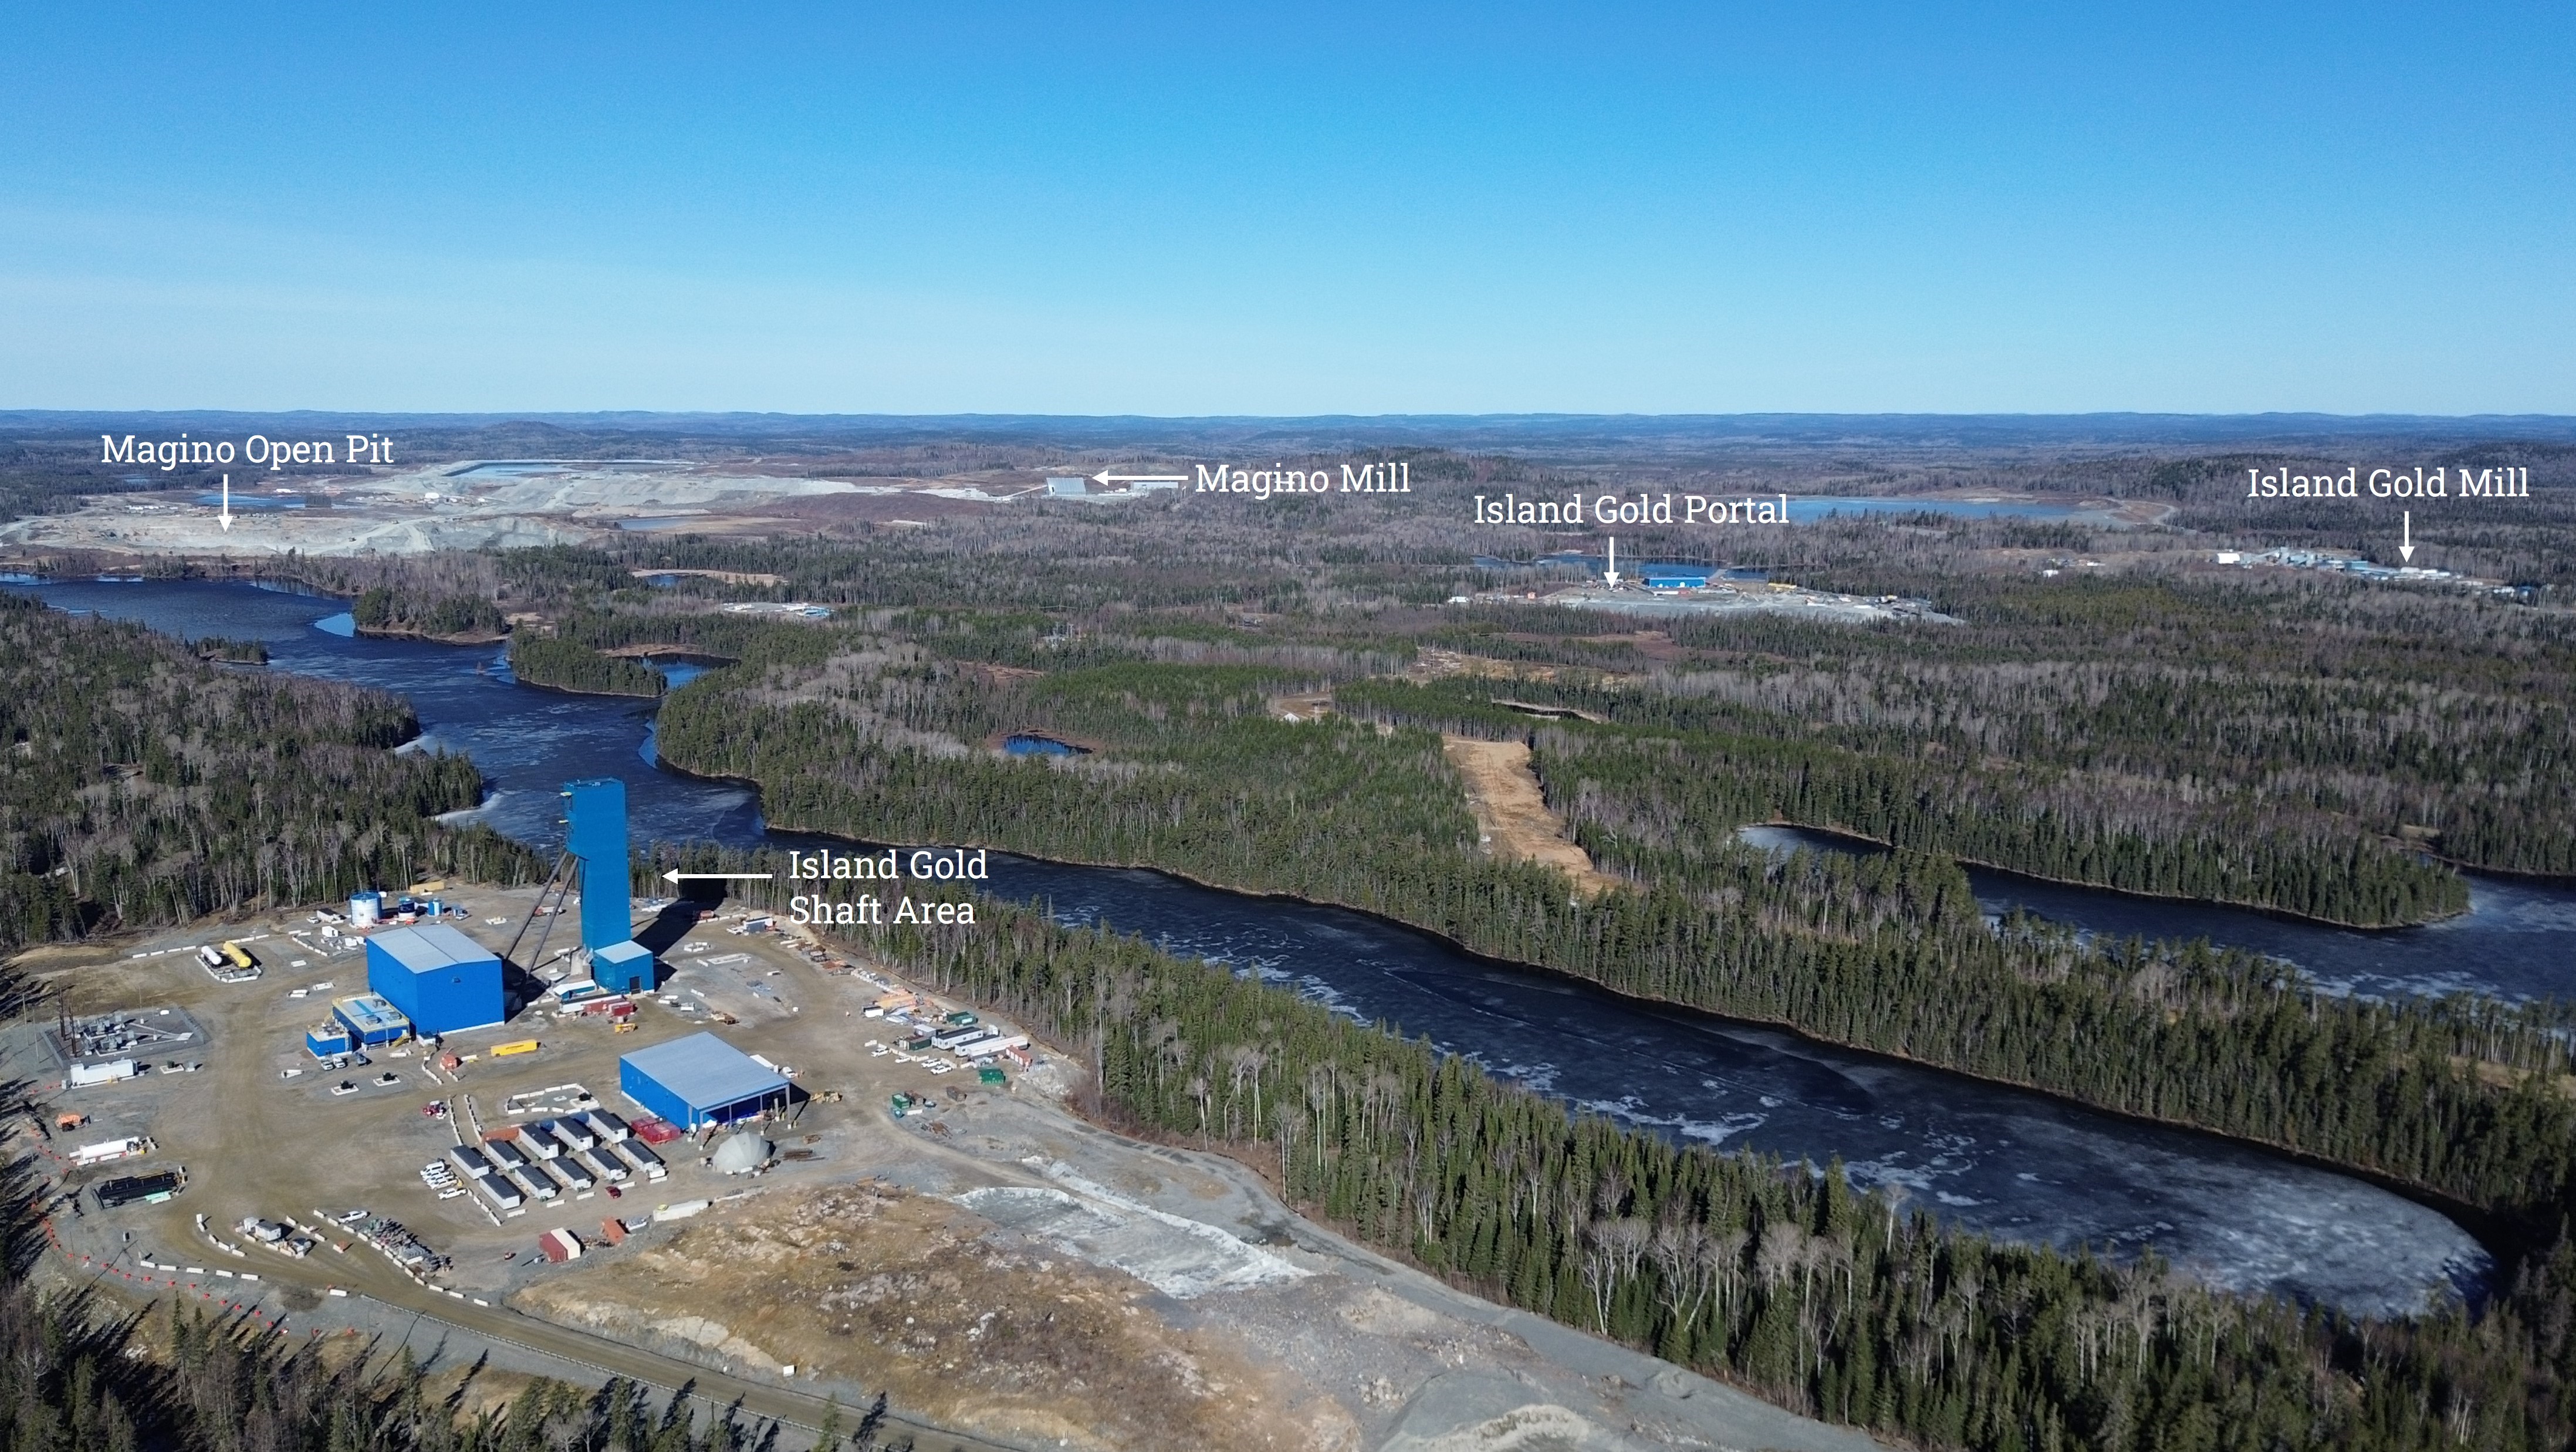
Shaft site area -
On
- average annual gold production of 207,000 ounces over the first five years and 176,000 ounces over the initial 10 years
- low-cost profile: average mine-site all-in sustaining costs of
$699 per ounce over the first 10-years and$814 per ounce over the life of mine - 44% larger Mineral Reserve totaling 2.3 million ounces grading 1.52 g/t Au (47.6 million tonnes ("mt"))
- 17-year mine life, life of mine production of 2.2 million ounces
- After-tax net present value (“NPV”) (5%) of
$428 million (base case gold price assumption of$1,675 per ounce and USD/CAD foreign exchange rate of$0 .75:1); after-tax internal rate of return (“IRR”) of 17% - After-tax NPV (5%) of
$670 million , and an after-tax IRR of 22%, at current gold prices of approximately$1,950 per ounce - Payback of less than four years at the base case gold price of
$1,675 per ounce and less than three years at a$1,950 per ounce gold prices
Development spending (excluding exploration) was
Kirazlı (Çanakkale, Türkiye)
On
On
Bilateral investment treaties are agreements between countries to assist with the protection of investments. The Treaty establishes legal protections for investment between Türkiye and
The Company incurred
First Quarter 2024 Exploration Activities
Island Gold (
The 2024 near mine exploration program will continue to focus on defining new Mineral Reserves and Resources in proximity to existing production horizons and underground infrastructure through both underground and surface exploration drilling.
As announced on
The majority of these high-grade Mineral Reserve and Resource additions were in proximity to existing production horizons and infrastructure. This included additions within the main Island Gold structure as well as within the hanging wall and footwall. Given their proximity to existing infrastructure, these ounces are expected to be low cost to develop and could be incorporated into the mine plan and mined within the next several years, further increasing the value of the operation.
A total of
To support the underground exploration drilling program, 460 m of underground exploration drift development is planned to extend drill platforms on the 850 and 1025 m levels. In addition to the exploration budget, 32,000 m of underground delineation drilling has been planned and included in sustaining capital for Island Gold which will be focused on the conversion of the large Mineral Resource base to Mineral Reserves.
The 2024 regional exploration program will follow up on high-grade mineralization intersected at the Pine-Breccia and 88-60 targets, located 4 km and 7 km, respectively, from the Island Gold mine. Drilling will also be completed in proximity to the past-producing Cline and Edwards mines, as well as at the Island Gold North Shear target. Additionally, a comprehensive data compilation project is underway across the 40,000-hectare
During the first quarter, 11,967 m of underground exploration drilling was completed in 45 holes, and 2,631 m of surface drilling was completed in two holes. Additionally, a total of 9,425 m of underground delineation drilling was completed in 37 holes, focused on in-fill drilling to convert Mineral Resources to Mineral Reserves. A total of 159 m of underground exploration drift development was also completed during the first quarter.
The regional exploration drilling program also commenced in the first quarter, with 565 m completed in one hole targeting mineralization in the North Shear,
Total exploration expenditures during the first quarter of 2024 were
A total of
The regional program has been expanded with 7,000 m of surface drilling planned in 2024, up from 5,000 m in 2023. The focus will be on testing multiple near-surface targets across the 5,900 hectare Young-Davidson Property that could potentially provide supplemental mill feed.
During the first quarter, two underground exploration drills completed 7,753 m in 21 holes from the 9220 West exploration drift, 9025 East Footwall, and the 9620 hanging wall area. Drilling is targeting syenite-hosted mineralization as well as continuing to test mineralization in the hanging wall sediments and mafic-ultramafic stratigraphy.
In addition, 1,477 m of surface drilling was completed in four holes in the first quarter, in the Otisse NE target area.
Total exploration expenditures during the first quarter were
A total of
During the first quarter, exploration activities continued at PDA and the near-mine area with 10,130 m of drilling completed in 36 holes. Drilling was focused on infill drilling the GAP-Victor portion of the Mineral Resource.
Drilling also commenced at
Additionally, 2,139 m was drilled in six holes, testing greenfields targets across the property
During the first quarter, exploration spending at Mulatos totaled
A total of
Burnt Timber and Linkwood contain Inferred Mineral Resources totaling 1.6 million ounces grading 1.1 g/t Au (44 million tonnes) as of
Surface exploration drilling in the first quarter focused on the infill drilling program at Linkwood, with 8,564 m completed in 46 holes. Following the expected completion of the Linkwood program in the second quarter, the focus will shift to complete the infill drilling program at Burnt Timber, and the exploration drilling program at Maynard.
Exploration spending totaled
Review of First Quarter Financial Results
During the first quarter of 2024, the Company sold 132,849 ounces of gold for record operating revenues of
Cost of sales (which includes mining and processing costs, royalties, and amortization expense) were
Mining and processing costs were
Total cash costs of
Royalty expense was
Amortization of
The Company recognized earnings from operations of
The Company reported net earnings of
(1) Refer to the “Non-GAAP Measures and Additional GAAP Measures” disclosure at the end of this press release and associated MD&A for a description and calculation of these measures.
Associated Documents
This press release should be read in conjunction with the Company’s interim consolidated financial statements for the three-month period ended
Reminder of First Quarter 2024 Results Conference Call
The Company's senior management will host a conference call on
| (416) 340-2217 | |
| Toll free ( | (800) 806-5484 |
| Participant passcode: | 4626879# |
| Webcast: | www.alamosgold.com |
A playback will be available until
Qualified Persons
About Alamos
Alamos is a Canadian-based intermediate gold producer with diversified production from three operating mines in
FOR FURTHER INFORMATION, PLEASE CONTACT:
| Senior Vice President, Investor Relations | |
| (416) 368-9932 x 5439 | |
The TSX and NYSE have not reviewed and do not accept responsibility for the adequacy or accuracy of this release.
Cautionary Note Regarding Forward-Looking Statements
This press release contains or incorporates by reference “forward-looking statements” and “forward-looking information” as defined under applicable Canadian and
Such statements include, but may not be limited to, guidance and expectations pertaining to: gold production, production potential, gold grades, gold prices, free cash flow, total cash costs, all-in sustaining costs, mine-site all-in sustaining costs, capital expenditures, total sustaining and growth capital, capitalized exploration, future fluctuations in the Company’s effective tax rate and other statements related to the payment of taxes, including cash tax payments in
Alamos cautions that forward-looking statements are necessarily based upon a number of factors and assumptions that, while considered reasonable by the Company at the time of making such statements, are inherently subject to significant business, economic, technical, legal, political and competitive uncertainties and contingencies. Known and unknown factors could cause actual results to differ materially from those projected in the forward-looking statements and undue reliance should not be placed on such statements and information.
Risk factors that may affect Alamos’ ability to achieve the expectations set forth in the forward-looking statements in this document include, but are not limited to: changes to current estimates of mineral reserves and resources; changes to production estimates (which assume accuracy of projected ore grade, mining rates, recovery timing and recovery rate estimates which may be impacted by unscheduled maintenance, weather issues, labour and contractor availability and other operating or technical difficulties); operations may be exposed to illnesses, diseases, epidemics and pandemics, including any ongoing effects and potential further effects of COVID-19; the impact of any illness, disease, epidemic or pandemic on the broader market and the trading price of the Company's shares; provincial and federal orders or mandates (including with respect to mining operations generally or auxiliary businesses or services required for the Company’s operations) in
Additional risk factors and details with respect to risk factors that may affect the Company’s ability to achieve the expectations set forth in the forward-looking statements contained in this press release are set out in the Company's latest 40-F/Annual Information Form under the heading “Risk Factors”, which is available on the SEDAR+ website at www.sedarplus.ca or on EDGAR at www.sec.gov. The foregoing should be reviewed in conjunction with the information, risk factors and assumptions found in this press release.
The Company disclaims any intention or obligation to update or revise any forward-looking statements whether as a result of new information, future events or otherwise, except as required by applicable law.
Cautionary Note to U.S. Investors Concerning Measured, Indicated and Inferred Resources
Measured, Indicated and Inferred Resources: All resource and reserve estimates included in this press release or documents referenced in this press release have been prepared in accordance with Canadian National Instrument 43-101 - Standards of Disclosure for Mineral Projects ("NI 43-101") and the
Investors are cautioned that while the above terms are “substantially similar” to CIM Definitions, there are differences in the definitions under Regulation S-K 1300 and the CIM Standards. Accordingly, there is no assurance any mineral reserves or mineral resources that the Company may report as “proven mineral reserves”, “probable mineral reserves”, “measured mineral resources”, “indicated mineral resources” and “inferred mineral resources” under NI 43-101 would be the same had the Company prepared the mineral reserve or mineral resource estimates under the standards adopted under Regulation S-K 1300. U.S. investors are also cautioned that while the
International Financial Reporting Standards: The consolidated financial statements of the Company have been prepared by management in accordance with International Financial Reporting Standards, as issued by the
Non-GAAP Measures and Additional GAAP Measures
The Company has included certain non-GAAP financial measures to supplement its Consolidated Financial Statements, which are presented in accordance with IFRS, including the following:
- adjusted net earnings and adjusted earnings per share;
- cash flow from operating activities before changes in working capital and taxes received;
- company-wide free cash flow;
- total mine-site free cash flow;
- mine-site free cash flow;
- total cash cost per ounce of gold sold;
- AISC per ounce of gold sold;
- Mine-site AISC per ounce of gold sold;
- sustaining and non-sustaining capital expenditures; and
- earnings before interest, taxes, depreciation, and amortization ("EBITDA")
The Company believes that these measures, together with measures determined in accordance with IFRS, provide investors with an improved ability to evaluate the underlying performance of the Company. Non-GAAP financial measures do not have any standardized meaning prescribed under IFRS, and therefore they may not be comparable to similar measures employed by other companies. The data is intended to provide additional information and should not be considered in isolation or as a substitute for measures of performance prepared in accordance with IFRS. Management's determination of the components of non-GAAP and additional measures are evaluated on a periodic basis influenced by new items and transactions, a review of investor uses and new regulations as applicable. Any changes to the measures are dully noted and retrospectively applied as applicable.
Adjusted Net Earnings and Adjusted Earnings per Share
“Adjusted net earnings” and “adjusted earnings per share” are non-GAAP financial measures with no standard meaning under IFRS which exclude the following from net earnings (loss):
- Foreign exchange (gain) loss
- Items included in other loss
- Certain non-recurring items
- Foreign exchange loss recorded in deferred tax expense
- The income and mining tax impact of items included in other loss
Net earnings have been adjusted, including the associated tax impact, for the group of costs in “other loss” on the consolidated statement of comprehensive income. Transactions within this grouping are: the fair value changes on non-hedged derivatives; loss on disposal of assets; and Turkish Projects care and maintenance and arbitration costs. The adjusted entries are also impacted for tax to the extent that the underlying entries are impacted for tax in the unadjusted net earnings.
The Company uses adjusted net earnings for its own internal purposes. Management’s internal budgets and forecasts and public guidance do not reflect the items which have been excluded from the determination of adjusted net earnings. Consequently, the presentation of adjusted net earnings enables shareholders to better understand the underlying operating performance of the core mining business through the eyes of management. Management periodically evaluates the components of adjusted net earnings based on an internal assessment of performance measures that are useful for evaluating the operating performance of our business and a review of the non-GAAP measures used by mining industry analysts and other mining companies.
Adjusted net earnings is intended to provide additional information only and does not have any standardized meaning under IFRS and may not be comparable to similar measures presented by other companies. It should not be considered in isolation or as a substitute for measures of performance prepared in accordance with IFRS. The measure is not necessarily indicative of operating profit or cash flows from operations as determined under IFRS. The following table reconciles this non-GAAP measure to the most directly comparable IFRS measure.
| (in millions) | ||||||
| Three Months Ended | ||||||
| 2024 | 2023 | |||||
| Net earnings | ||||||
| Adjustments: | ||||||
| Foreign exchange loss | 0.9 | 0.1 | ||||
| Other loss | 4.8 | 1.3 | ||||
| Unrealized foreign exchange loss (gain) recorded in deferred tax expense | 3.6 | (4.2 | ) | |||
| Other income and mining tax adjustments | (0.2 | ) | (0.2 | ) | ||
| Adjusted net earnings | ||||||
| Adjusted earnings per share - basic | ||||||
Cash Flow from Operating Activities before Changes in Working Capital and Cash Taxes
“Cash flow from operating activities before changes in working capital and cash taxes” is a non-GAAP performance measure that could provide an indication of the Company’s ability to generate cash flows from operations, and is calculated by adding back the change in working capital and taxes received to “Cash provided by (used in) operating activities” as presented on the Company’s consolidated statements of cash flows. “Cash flow from operating activities before changes in working capital” is a non-GAAP financial measure with no standard meaning under IFRS.
The following table reconciles the non-GAAP measure to the consolidated statements of cash flows.
| (in millions) | ||||
| Three Months Ended | ||||
| 2024 | 2023 | |||
| Cash flow from operating activities | ||||
| Add: Changes in working capital and taxes paid | 26.0 | 32.9 | ||
| Cash flow from operating activities before changes in working capital and taxes paid | $134.9 | $127.2 | ||
Company-wide Free Cash Flow
“Company-wide free cash flow" is a non-GAAP performance measure calculated from the consolidated operating cash flow, less consolidated mineral property, plant and equipment expenditures. The Company believes this to be a useful indicator of our ability to operate without reliance on additional borrowing or usage of existing cash company-wide. Company-wide free cash flow is intended to provide additional information only and does not have any standardized meaning under IFRS and may not be comparable to similar measures of performance presented by other mining companies. Company-wide free cash flow should not be considered in isolation or as a substitute for measures of performance prepared in accordance with IFRS.
| (in millions) | ||||||
| Three Months Ended | ||||||
| 2024 | 2023 | |||||
| Cash flow from operating activities | ||||||
| Less: mineral property, plant and equipment expenditures | (84.5 | ) | (83.8 | ) | ||
| Company-wide free cash flow | $24.4 | $10.5 | ||||
Mine-site Free Cash Flow
"Mine-site free cash flow" is a non-GAAP financial performance measure calculated as cash flow from mine-site operating activities, less mineral property, plant and equipment expenditures. The Company believes this to be a useful indicator of our ability to operate without reliance on additional borrowing or usage of existing cash. Mine-site free cash flow is intended to provide additional information only and does not have any standardized meaning under IFRS and may not be comparable to similar measures of performance presented by other mining companies. Mine-site free cash flow should not be considered in isolation or as a substitute for measures of performance prepared in accordance with IFRS.
| Consolidated Mine-Site Free Cash Flow | Three Months Ended | |||||
| 2024 | 2023 | |||||
| (in millions) | ||||||
| Cash flow from operating activities | ||||||
| Add: operating cash flow used by non-mine site activity | 20.4 | 18.4 | ||||
| Cash flow from operating mine-sites | $129.3 | $112.7 | ||||
| Mineral property, plant and equipment expenditure | ||||||
| Less: capital expenditures from development projects, and corporate | (5.8 | ) | (3.7 | ) | ||
| Capital expenditure and capital advances from mine-sites | $78.7 | $80.1 | ||||
| Total mine-site free cash flow | $50.6 | $32.6 | ||||
| Young-Davidson Mine-Site Free Cash Flow | Three Months Ended | |||||
| 2024 | 2023 | |||||
| (in millions) | ||||||
| Cash flow from operating activities | ||||||
| Mineral property, plant and equipment expenditure | (20.2 | ) | (17.4 | ) | ||
| Mine-site free cash flow | $14.6 | $16.3 | ||||
| Island Gold Mine-Site Free Cash Flow | Three Months Ended | |||||
| 2024 | 2023 | |||||
| (in millions) | ||||||
| Cash flow from operating activities | ||||||
| Mineral property, plant and equipment expenditure | (54.6 | ) | (57.0 | ) | ||
| Mine-site free cash flow | ($13.7 | ) | ($20.5 | ) | ||
| Mulatos District Free Cash Flow | Three Months Ended | |||||
| 2023 | 2022 | |||||
| (in millions) | ||||||
| Cash flow from operating activities | ||||||
| Mineral property, plant and equipment expenditure | (3.9 | ) | (5.7 | ) | ||
| Mine-site free cash flow | $49.7 | $36.8 | ||||
Total Cash Costs per ounce
Total cash costs per ounce is a non-GAAP term typically used by gold mining companies to assess the level of gross margin available to the Company by subtracting these costs from the unit price realized during the period. This non-GAAP term is also used to assess the ability of a mining company to generate cash flow from operations. Total cash costs per ounce includes mining and processing costs plus applicable royalties, and net of by-product revenue and net realizable value adjustments. Total cash costs per ounce is exclusive of exploration costs.
Total cash costs per ounce is intended to provide additional information only and does not have any standardized meaning under IFRS and may not be comparable to similar measures presented by other mining companies. It should not be considered in isolation or as a substitute for measures of performance prepared in accordance with IFRS. The measure is not necessarily indicative of cash flow from operations under IFRS or operating costs presented under IFRS.
All-in Sustaining Costs per ounce and Mine-site All-in Sustaining Costs
The Company adopted an “all-in sustaining costs per ounce” non-GAAP performance measure in accordance with the
For the purposes of calculating "mine-site all-in sustaining costs" at the individual mine-sites, the Company does not include an allocation of corporate and administrative costs and share-based compensation, as detailed in the reconciliations below.
Sustaining capital expenditures are expenditures that do not increase annual gold ounce production at a mine site and excludes all expenditures at the Company’s development projects as well as certain expenditures at the Company’s operating sites that are deemed expansionary in nature. Non-sustaining capital expenditures are expenditures primarily incurred at development projects and costs related to major projects at existing operations, where these projects will materially benefit the mine site. Capitalized exploration expenditures are expenditures that meet the IFRS definition for capitalization, and are incurred to further expand the known Mineral Reserve and Resource at existing operations or development projects. For each mine-site reconciliation, corporate and administrative costs, and non-site specific costs are not included in the all-in sustaining cost per ounce calculation.
All-in sustaining costs per gold ounce is intended to provide additional information only and does not have any standardized meaning under IFRS and may not be comparable to similar measures presented by other mining companies. It should not be considered in isolation or as a substitute for measures of performance prepared in accordance with IFRS.
The measure is not necessarily indicative of cash flow from operations under IFRS or operating costs presented under IFRS.
Total Cash Costs and All-in Sustaining Costs per Ounce Reconciliation Tables
The following tables reconciles these non-GAAP measures to the most directly comparable IFRS measures on a Company-wide and individual mine-site basis.
| Total Cash Costs and AISC Reconciliation - Company-wide | |||||
| Three Months Ended | |||||
| 2024 | 2023 | ||||
| (in millions, except ounces and per ounce figures) | |||||
| Mining and processing | |||||
| By-product credits | (2.7 | ) | — | ||
| Royalties | 2.6 | 2.5 | |||
| Total cash costs | 120.9 | 108.9 | |||
| Gold ounces sold | 132,849 | 132,668 | |||
| Total cash costs per ounce | $910 | $821 | |||
| Total cash costs | |||||
| Corporate and administrative (1) | 7.9 | 6.7 | |||
| Sustaining capital expenditures (2) | 26.5 | 26.9 | |||
| Share-based compensation | 9.9 | 11.1 | |||
| Sustaining exploration | 0.8 | 0.7 | |||
| Accretion of decommissioning liabilities | 2.0 | 1.7 | |||
| Total all-in sustaining costs | |||||
| Gold ounces sold | 132,849 | 132,668 | |||
| All-in sustaining costs per ounce | $1,265 | $1,176 | |||
(1) Corporate and administrative expenses exclude expenses incurred at development properties.
(2) Sustaining capital expenditures are defined as those expenditures which do not increase annual gold ounce production at a mine site and exclude all expenditures at growth projects and certain expenditures at operating sites which are deemed expansionary in nature. Total sustaining capital expenditures for the period are as follows:
| Three Months Ended | ||||||
| 2024 | 2023 | |||||
| (in millions) | ||||||
| Capital expenditures per cash flow statement | ||||||
| Less: non-sustaining capital expenditures at: | ||||||
| (8.6 | ) | (4.2 | ) | |||
| Island Gold | (41.1 | ) | (45.6 | ) | ||
| (2.5 | ) | (3.4 | ) | |||
| Corporate and other | (5.8 | ) | (3.7 | ) | ||
| Sustaining capital expenditures | ||||||
| Young-Davidson Total Cash Costs and Mine-site AISC Reconciliation | |||||
| Three Months Ended | |||||
| 2024 | 2023 | ||||
| (in millions, except ounces and per ounce figures) | |||||
| Mining and processing | |||||
| By-product credits | (0.6 | ) | — | ||
| Royalties | 1.3 | 1.4 | |||
| Total cash costs | |||||
| Gold ounces sold | 39,810 | 45,676 | |||
| Total cash costs per ounce | $1,188 | $941 | |||
| Total cash costs | |||||
| Sustaining capital expenditures | 11.6 | 13.2 | |||
| Accretion of decommissioning liabilities | 0.1 | 0.1 | |||
| Total all-in sustaining costs | |||||
| Gold ounces sold | 39,810 | 45,676 | |||
| Mine-site all-in sustaining costs per ounce | $1,482 | $1,233 | |||
| Island Gold Total Cash Costs and Mine-site AISC Reconciliation | |||||
| Three Months Ended | |||||
| 2024 | 2023 | ||||
| (in millions, except ounces and per ounce figures) | |||||
| Mining and processing | |||||
| By-product credits | (0.2 | ) | — | ||
| Royalties | 0.7 | 0.6 | |||
| Total cash costs | |||||
| Gold ounces sold | 34,130 | 33,727 | |||
| Total cash costs per ounce | $706 | $629 | |||
| Total cash costs | |||||
| Sustaining capital expenditures | 13.5 | 11.4 | |||
| Accretion of decommissioning liabilities | 0.1 | 0.1 | |||
| Total all-in sustaining costs | |||||
| Gold ounces sold | 34,130 | 33,727 | |||
| Mine-site all-in sustaining costs per ounce | $1,105 | $970 | |||
| Mulatos District Total Cash Costs and Mine-site AISC Reconciliation | |||||
| Three Months Ended | |||||
| 2024 | 2023 | ||||
| (in millions, except ounces and per ounce figures) | |||||
| Mining and processing | |||||
| By-product credits | (1.9 | ) | — | ||
| Royalties | 0.6 | 0.5 | |||
| Total cash costs | |||||
| Gold ounces sold | 58,909 | 53,265 | |||
| Total cash costs per ounce | $840 | $839 | |||
| Total cash costs | |||||
| Sustaining capital expenditures | 1.4 | 2.3 | |||
| Sustaining exploration | 0.6 | 0.2 | |||
| Accretion of decommissioning liabilities | 1.8 | 1.5 | |||
| Total all-in sustaining costs | |||||
| Gold ounces sold | 58,909 | 53,265 | |||
| Mine-site all-in sustaining costs per ounce | $905 | $914 | |||
EBITDA
EBITDA represents net earnings before impairment charges, interest, taxes, depreciation, and amortization. EBITDA is an indicator of the Company’s ability to generate liquidity by producing operating cash flow to fund working capital needs, service debt obligations, and fund capital expenditures.
EBITDA does not have any standardized meaning under IFRS and may not be comparable to similar measures presented by other mining companies. It should not be considered in isolation or as a substitute for measures of performance prepared in accordance with IFRS.
The following is a reconciliation of EBITDA to the consolidated financial statements:
| (in millions) | ||||
| Three Months Ended | ||||
| 2024 | 2023 | |||
| Net earnings | ||||
| Add back: | ||||
| Finance expense | 0.1 | 1.4 | ||
| Amortization | 50.0 | 46.3 | ||
| Deferred income tax expense | 16.5 | 0.4 | ||
| Current income tax expense | 17.0 | 23.4 | ||
| EBITDA | $125.7 | $119.9 | ||
Additional GAAP Measures
Additional GAAP measures are presented on the face of the Company’s consolidated statements of comprehensive income (loss) and are not meant to be a substitute for other subtotals or totals presented in accordance with IFRS, but rather should be evaluated in conjunction with such IFRS measures. The following additional GAAP measures are used and are intended to provide an indication of the Company’s mine and operating performance:
- Earnings from operations - represents the amount of earnings before net finance income/expense, foreign exchange gain/loss, other income/loss, loss on redemption of senior secured notes and income tax expense
Unaudited Consolidated Statements of Financial Position, Comprehensive
Income, and Cash Flow
Condensed Interim Consolidated Statements of Financial Position
(Unaudited - stated in millions of
| A S S E T S | |||||||
| Current Assets | |||||||
| Cash and cash equivalents | |||||||
| Equity securities | 16.3 | 13.0 | |||||
| Amounts receivable | 39.5 | 53.4 | |||||
| Inventory | 252.4 | 271.2 | |||||
| Other current assets | 20.0 | 23.6 | |||||
| Total Current Assets | 568.4 | 586.0 | |||||
| Non-Current Assets | |||||||
| Mineral property, plant and equipment | 3,384.1 | 3,360.1 | |||||
| Deferred income taxes | 13.4 | 9.0 | |||||
| Other non-current assets | 45.6 | 46.1 | |||||
| Total Assets | $4,011.5 | $4,001.2 | |||||
| L I A B I L I T I E S | |||||||
| Current Liabilities | |||||||
| Accounts payable and accrued liabilities | |||||||
| Income taxes payable | 14.0 | 40.3 | |||||
| Decommissioning liability | 10.4 | 12.6 | |||||
| Total Current Liabilities | 203.7 | 247.9 | |||||
| Non-Current Liabilities | |||||||
| Deferred income taxes | 723.8 | 703.6 | |||||
| Decommissioning liabilities | 125.8 | 124.2 | |||||
| Other non-current liabilities | 2.0 | 2.0 | |||||
| Total Liabilities | 1,055.3 | 1,077.7 | |||||
| E Q U I T Y | |||||||
| Share capital | |||||||
| Contributed surplus | 87.0 | 88.6 | |||||
| Accumulated other comprehensive loss | (28.2 | ) | (26.9 | ) | |||
| Deficit | (842.4 | ) | (876.8 | ) | |||
| Total Equity | 2,956.2 | 2,923.5 | |||||
| Total Liabilities and Equity | $4,011.5 | $4,001.2 | |||||
Condensed Interim Consolidated Statements of Comprehensive Income
For the Three Months Ended
(Unaudited - stated in millions of
| OPERATING REVENUES | |||||||
| COST OF SALES | |||||||
| Mining and processing | 121.0 | 106.4 | |||||
| Royalties | 2.6 | 2.5 | |||||
| Amortization | 50.0 | 46.3 | |||||
| 173.6 | 155.2 | ||||||
| EXPENSES | |||||||
| Exploration | 4.8 | 3.5 | |||||
| Corporate and administrative | 7.9 | 6.7 | |||||
| Share-based compensation | 9.9 | 11.1 | |||||
| 196.2 | 176.5 | ||||||
| EARNINGS BEFORE INCOME TAXES | 81.4 | 75.0 | |||||
| OTHER EXPENSES | |||||||
| Finance expense | (0.1 | ) | (1.4 | ) | |||
| Foreign exchange loss | (0.9 | ) | (0.1 | ) | |||
| Other loss | (4.8 | ) | (1.3 | ) | |||
| EARNINGS BEFORE INCOME TAXES | $75.6 | $72.2 | |||||
| INCOME TAXES | |||||||
| Current income tax expense | (17.0 | ) | (23.4 | ) | |||
| Deferred income tax expense | (16.5 | ) | (0.4 | ) | |||
| NET EARNINGS | $42.1 | $48.4 | |||||
| Items that may be subsequently reclassified to net earnings: | |||||||
| Net change in fair value of currency hedging instruments, net of taxes | (3.9 | ) | 4.3 | ||||
| Net change in fair value of fuel hedging instruments, net of taxes | 0.1 | (0.2 | ) | ||||
| Items that will not be reclassified to net earnings: | |||||||
| Unrealized gain on equity securities, net of taxes | 2.5 | 1.2 | |||||
| Total other comprehensive (loss) income | ($ | 1.3 | ) | $5.3 | |||
| COMPREHENSIVE INCOME | $40.8 | $53.7 | |||||
| EARNINGS PER SHARE | |||||||
| – basic | $0.11 | $0.12 | |||||
| – diluted | $0.11 | $0.12 | |||||
Condensed Interim Consolidated Statements of Cash Flows
For the Three Months Ended
(Unaudited - stated in millions of
| CASH PROVIDED BY (USED IN): | |||||||
| OPERATING ACTIVITIES | |||||||
| Net earnings | |||||||
| Adjustments for items not involving cash: | |||||||
| Amortization | 50.0 | 46.3 | |||||
| Foreign exchange gain | 0.9 | 0.1 | |||||
| Current income tax expense | 17.0 | 23.4 | |||||
| Deferred income tax expense | 16.5 | 0.4 | |||||
| Share-based compensation | 9.9 | 11.1 | |||||
| Finance expense | 0.1 | 1.4 | |||||
| Other | (1.6 | ) | (3.9 | ) | |||
| Changes in working capital and taxes paid | (26.0 | ) | (32.9 | ) | |||
| 108.9 | 94.3 | ||||||
| INVESTING ACTIVITIES | |||||||
| Mineral property, plant and equipment | (84.5 | ) | (83.8 | ) | |||
| Investment in equity securities | — | (1.0 | ) | ||||
| (84.5 | ) | (84.8 | ) | ||||
| FINANCING ACTIVITIES | |||||||
| Dividends paid | (8.7 | ) | (9.2 | ) | |||
| Credit facility interest and transaction fees | (0.9 | ) | — | ||||
| Proceeds from the exercise of options and warrants | 0.5 | 3.6 | |||||
| (9.1 | ) | (5.6 | ) | ||||
| Effect of exchange rates on cash and cash equivalents | 0.1 | 0.1 | |||||
| Net increase in cash and cash equivalents | 15.4 | 4.0 | |||||
| Cash and cash equivalents - beginning of period | 224.8 | 129.8 | |||||
| CASH AND CASH EQUIVALENTS - END OF PERIOD | $240.2 | $133.8 | |||||

![]()
Island Gold _ Shaft Site Area - April 2024
Island Gold _ Shaft Site Area - April 2024
2024 GlobeNewswire, Inc., source
