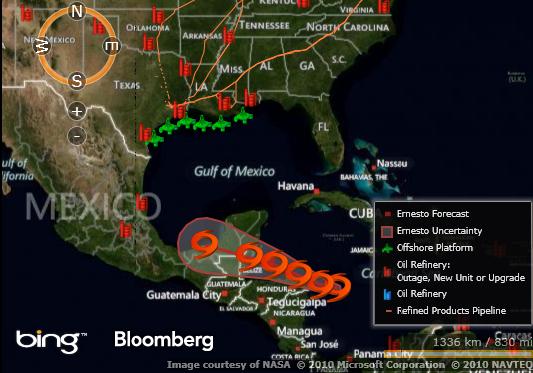
In this map, it is possible to see the evolution of tropical storm “Ernesto” (orange vortexes). We add also the offshore platforms (green), oil refinery (orange) and oil pipeline (orange line), in order to show the strategic position of the Gulf of Mexico.
Moreover, the Middle East region pushes prices up. Iranian output (third largest suppliers among members of OPEC) is in sharp decline due to US and European Union sanctions in order to dissuade Iran from pursuing a nuclear program. In July Iran pumped 2.86 million barrels a day, equivalent to 29% of Saudi Arabia’s production, compared with 37% a year earlier, according to Bloomberg.
In green Saudi Arabian oil production (bpd)
In red Iranian production
In orange the spread between Saudi Arabian and Iranian crude production.

According to an analyst of Raiffeisen Bank International in Wien, the oil price could continue to overheat thanks to a demand in China and US, in the wake of recovery expected in both countries.
Since July the WTI has gained more than 17%, retracing 50% of the bearish trend began in May. This level should play as technical resistance. In add, the oil trading in New York is testing the upper band of “ichimoku cloud”, an area where buy orders tend to be clustered (on the graph below you can see the evolution of WTI future with Ichimoku study). We forecast a bearish trend in the short-term; this seems to be also the sentiment of investors. Indeed, hedge funds reduced bullish oil bets in the week ended July 31, for the first time in three weeks. Money managers cut net long positions by 2.6%, according to the Commodity Futures Trading Commission’s Commitments of Traders report on August 3.
We suggest to take a long position in the commodity in case of breakout of “ichimoku cloud”, at USD 93. Thanks to Fibonacci retracement we can fix as first target USD 100 and then a return on USD 106 level.
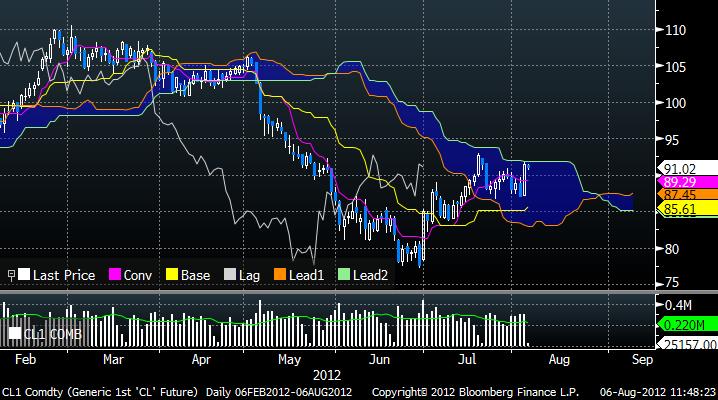
In this chart, it is possible to see the evolution of WTI future with Ichimoku study. We ask attention on the blue area, this range is so-called “ichimoku cloud”. If the asset is trading inside this range we don’t have a real trend, only if the commodity breakout or breakdown this range we can forecast respectively a bullish or bearish trend.
Follow @OscarSalza


